Graphs
OOPNET can be used together with the library networkx for graph theoretic use cases.
First, we import all dependencies and read the “Anytown” model. We need the following libraries:
osis used for specifying file pathsnetworkxprovides graph theoretical functionalitiesmatplotlib.pyplotis used for plottingseabornis based onmatplotliband is also used for plotting
import os

import networkx as nx
import pandas as pd
from matplotlib import pyplot as plt
import seaborn as sns
import oopnet as on

filename = os.path.join('data', 'anytown.inp')
network = on.Network.read(filename)
To use NetworkX, we have to create a graph object from our model. NetworkX supports different graph types:
networkx.Graphnetworkx.DiGraphnetworkx.MultiGraphnetworkx.MultiDiGraph
Choose a graph type that is suitable for the analysis you want to do. OOPNET provides factories to convert a Network to the classes listed above.
Warning
networkx.Graph and networkx.DiGraph do not support multiple connections between two vertices! This means, that if you have several pipes in parallel connecting two junctions, only one of those pipes will be kept in graph. If you want to keep all connections, use networkx.MultiGraph or networkx.MultiDiGraph instead.
To convert a network into a graph object, use one of the factory classes available:
In this example, we create a networkx.MultiGraph from our model:
G = on.MultiGraph(network)
The package NetworkX offers various possibilities like for example calculate different graph measurements like computing the graph theoretical Center, Diameter or Radius of the graph:
print(f'Center: {nx.center(G)}')
Center: ['1', '4', '13', '19', '18']
print(f'Diameter: {nx.diameter(G)}')
Diameter: 7
print(f'Radius: {nx.radius(G)}')
Radius: 4
Now, we use Google’s page rank algorithm on the network:
pr = nx.pagerank(G)
Let’s create a pandas.Series out of the results for better data handling. We then sort this series in descending order and give it a name. This name which will serve as a label for the color bar in OOPNET’s network plot:
pr = pd.Series(pr)
pr.sort_values(ascending=False, inplace=True)
pr.name = 'Page Rank'
First, we plot the results as a bar plot:
f, ax = plt.subplots()
pr.plot(kind='bar', ax=ax)
We can also plot the page rank series directly on the network nodes with OOPNET’s plot() function:
network.plot(nodes=pr)
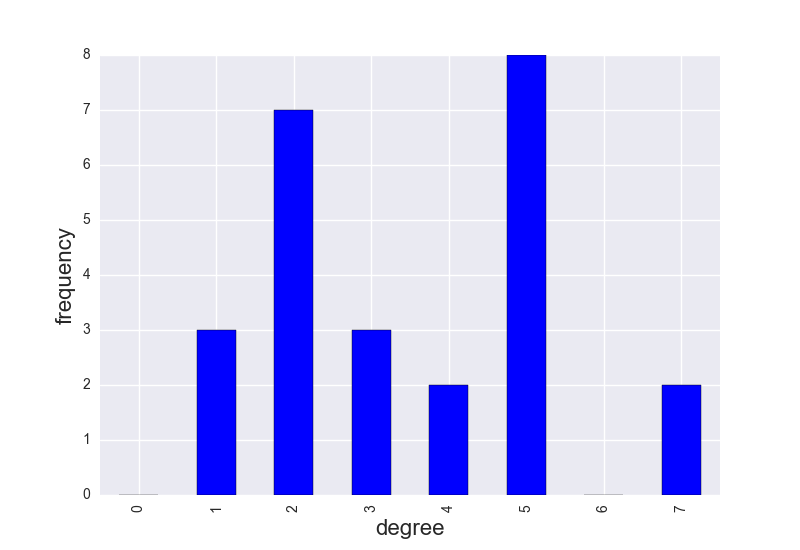
We can also calculate the degree of every node in the network and save it as a pandas.Series:
deg = nx.degree_histogram(G)
deg = pd.Series(deg)
Of course, we can also plot this again as a bar plot:
f, ax = plt.subplots()
deg.plot(kind='bar', ax=ax)
plt.xlabel('degree', fontsize=16)
plt.ylabel('frequency', fontsize=16)
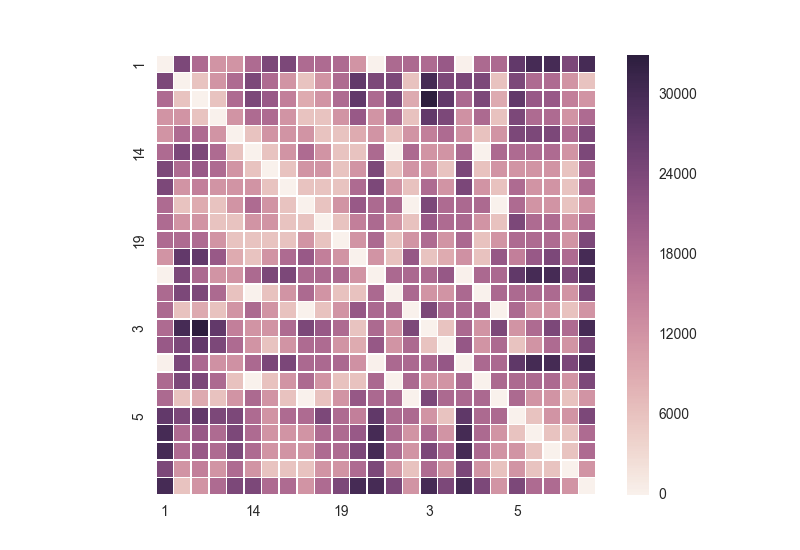
We can calculate all shortest paths in the network, save them as a pandas.DataFrame and plot them as a heatmap:
paths = dict(nx.all_pairs_dijkstra_path_length(G))
df = pd.DataFrame(paths)
f, ax = plt.subplots()

sns.heatmap(df, square=True, xticklabels=5, yticklabels=5, linewidths=.5)
plt.show()
Further Examples
Summary
import os

import networkx as nx
import pandas as pd
from matplotlib import pyplot as plt
import seaborn as sns
import oopnet as on

filename = os.path.join('data', 'anytown.inp')
network = on.Network.read(filename)

G = on.MultiGraph(network)

# Some graph theoretic measurements:
print(f'Center: {nx.center(G)}')
print(f'Diameter: {nx.diameter(G)}')
print(f'Radius: {nx.radius(G)}')

# Page Rank algorithm
pr = nx.pagerank(G)
pr = pd.Series(pr)
pr.sort_values(ascending=False, inplace=True)
pr.name = 'Page Rank'

# Barplot
f, ax = plt.subplots()
pr.plot(kind='bar', ax=ax)

# Plot PageRank in network
network.plot(nodes=pr)

# Histogram of degrees in the network
deg = nx.degree_histogram(G)
deg = pd.Series(deg)

f, ax = plt.subplots()
deg.plot(kind='bar', ax=ax)
plt.xlabel('degree', fontsize=16)
plt.ylabel('frequency', fontsize=16)

# Calculate all shortest paths:
paths = dict(nx.all_pairs_dijkstra_path_length(G))
df = pd.DataFrame(paths)

# Plot shortest paths between all nodes
f, ax = plt.subplots()

sns.heatmap(df, square=True, xticklabels=5, yticklabels=5, linewidths=.5)
plt.show()